Monitoring with Ganglia
by HEIG-Cloud
Tags:Posted on Mon, Dec 21, 2015
Ganglia
We already talked about the ELK stack which is very useful to centralize and access log files. But we still haven’t found a way to monitor the physical nodes themselves (use of CPU, memory, disks, network, etc.). Well that’s ganglia’s job ;-)
Ganglia is a free software that allows you to keep an eye on your cluster quite easily. This is the kind of information you can get:
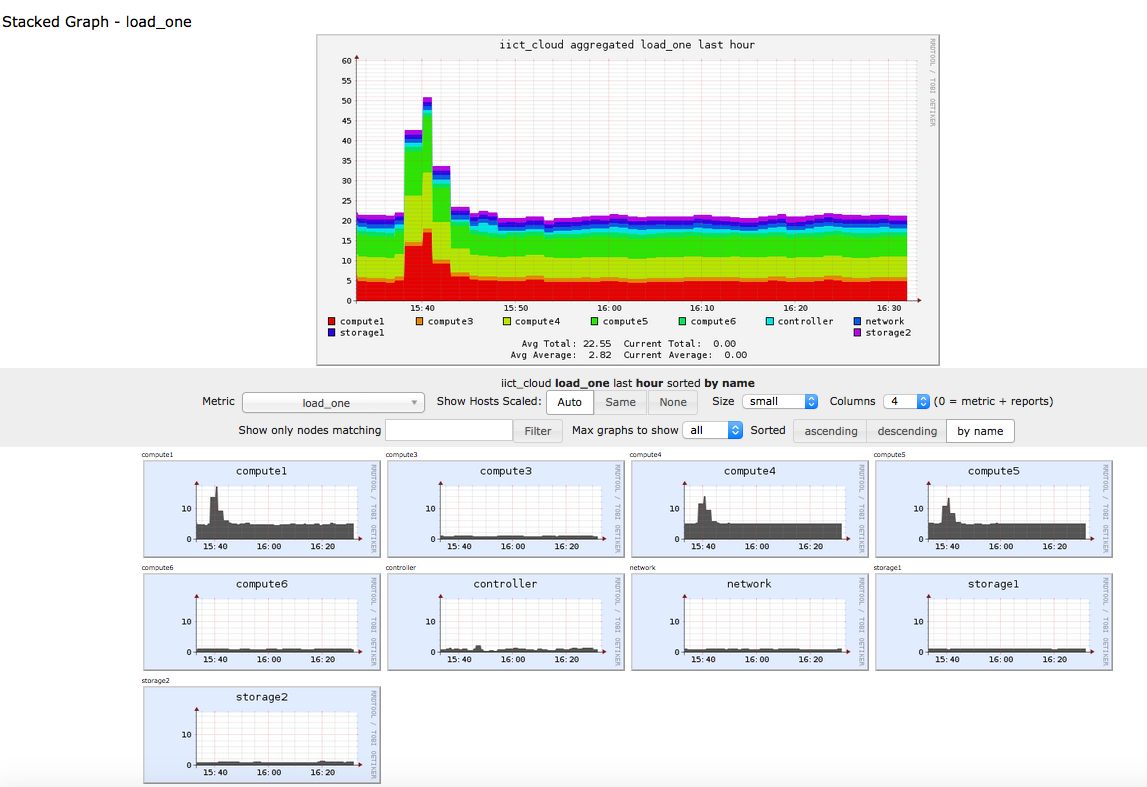
You can see here the use of resources, here we are seeing the load. There is a pic along the way, probably a job that was run at this moment.
How does ganglia work
Well there are basically two things ganglia has:
- gmond
- gmetad
Gmond is the service that collects the information on a host and sends it to the central server, who runs gmetad. Gmond is also the one to receive information (we usually disable this on agent nodes). Gmetad is the metrics service who runs on the ganglia server. Usually, the server also needs to be monitored, so it’ll run gmond and gmetad at the same time.
The process is quite simple, the daemons on the hosts send periodically their innformation to the server through the port 8649/UDP.
There are many customisations, we can have various servers, use multicast to manage the connection between hosts and change the intervals but we’ll keep a very basic configuration.
Configure server
You need to edit the /etc/ganglia/gmetad.conf file and add the following line
$ sudo nano /etc/ganglia/gmetad.conf
data_source "cluster_name" 60 {{ controller_host }}
If you’ve read the article about Ansible, you know that {{ controller_host }} is a variable that represents the IP of the controller, which is also used as the ganglia server. You can also just type the IP if you are not using Ansible. As for the cluster_name value, you can put anything you like but you’ll have to use it again when configuring the agents so don’t forget it. Now for the gmond.conf file:
$ sudo nano /etc/ganglia/gmond.conf

cluster {
  name = "cluster_name" # same name as above
  owner = "unspecified"
  latlong = "unspecified"
  url = "unspecified"
}

/* Feel free to specify as many udp_send_channels as you like.  Gmond
   used to only support having a single channel */
udp_send_channel {
  #mcast_join = 239.2.11.71 #comment this line
  host = {{ controller_host }} # add the IP of your controller
  port = 8649
  ttl = 1
}

/* You can specify as many udp_recv_channels as you like as well. */
udp_recv_channel {
  #mcast_join = 239.2.11.71 # comment
  port = 8649 # The port that will receive information
  #bind = 239.2.11.71 # comment
}
And that’s all, no need to change the rest. So basically what we did was:
- Tell the agent to send the info to the controller on port 8649
- To listen on UDP 8649 (information from the other hosts will arrive through here).
That’s all for the server.
Apache
The last thing to do is to put this in a file in the enabled-websites of your webserver:
Alias /ganglia /usr/share/ganglia-webfrontend

<Directory "/usr/share/ganglia-webfrontend">
    AllowOverride All
    Order allow,deny
    Allow from all
    Deny from none
</Directory>
Configure agents
We still need to configure the other hosts, we will need to change the gmond.conf files again.
$ sudo nano /etc/ganglia/gmond.conf

/* If a cluster attribute is specified, then all gmond hosts are wrapped inside
 * of a <CLUSTER> tag.  If you do not specify a cluster tag, then all <HOSTS> will
 * NOT be wrapped inside of a <CLUSTER> tag. */
cluster {
  name = "cluster_name" # alwasy the same cluster_name
  owner = "unspecified"
  latlong = "unspecified"
  url = "unspecified"
}

/* Feel free to specify as many udp_send_channels as you like.  Gmond
   used to only support having a single channel */
udp_send_channel {
  #mcast_join = 239.2.11.71 # comment this
  host = {{ controller_host }} # controller's IP
  port = 8649 # port 8649 to send info
  ttl = 1
}

# Comment this whole thing
/*
udp_recv_channel {
  mcast_join = 239.2.11.71
  port = 8649
  bind = 239.2.11.71
}
*/
Last step is to restart the services.
Controller:
$ sudo service gmetad restart
$ sudo service ganglia-monitor restart
$ sudo service apache2 restart
Hosts:
$ sudo service ganglia-monitor restart
Note: Reboot gmetad first and then reboot the ganglia-monitor service on the hosts. You must always start ganglia-monitor after gmetad, so if you need to reboot gmetad, also reboot ganglia-monitor on all hosts or they won’t send their metrics.
Accessing the webpage
To access the monitoring interface, go to:
http://controller/ganglia

# Replace controller by IP if not in your DNS or hosts file.
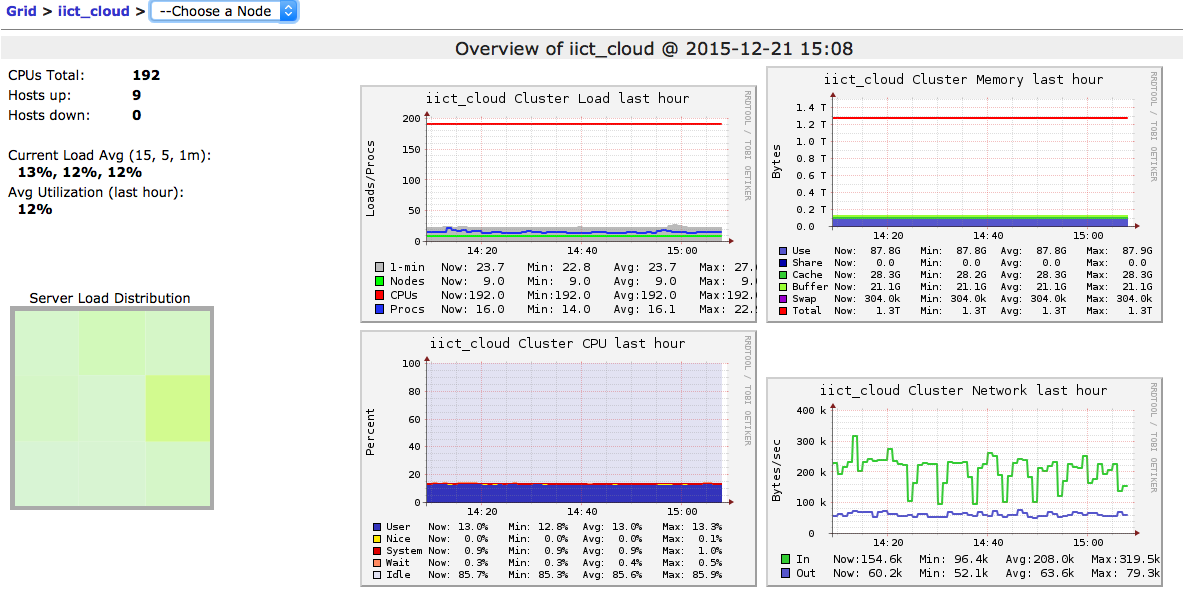
Here is another sample of the informations you can get. Here you see general informations, as memory, cpu, load and network for the entire cluster called iict_cloud.
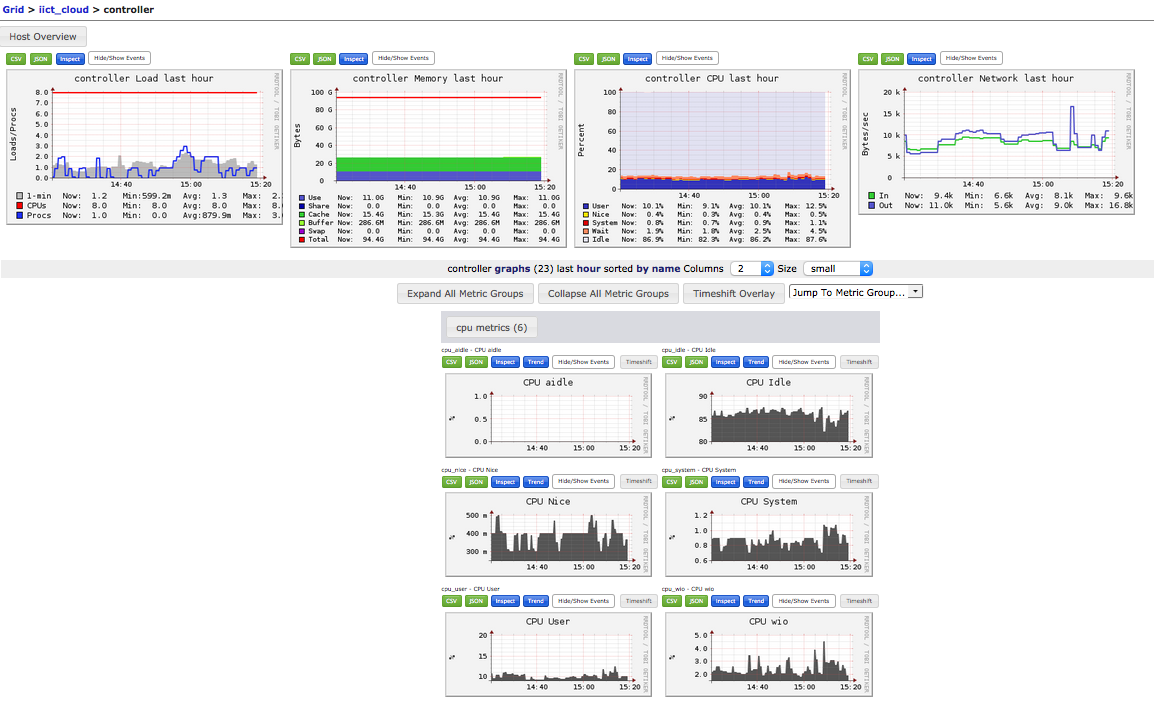
And here we can see more information about one host, the controller, its CPU usages and specific information.
Conclusion
That’s all for Ganglia, we won’t cover how to use it as it’s quite easy, you can also check the official website.